
Introduction — why a data-first approach matters
Manufacturers must measure what matters. A data-driven monitoring strategy turns sensor feeds and system logs into clear operational decisions for automotive automation. Start with the outcomes you need: uptime, quality, throughput and traceability. From that starting line, select metrics and feeds that map directly to those outcomes.

Core metrics to capture and why they matter
Focus on a concise set of high-fidelity indicators that explain cause and effect. Track these continuously and correlate them for root-cause work.
– Overall Equipment Effectiveness (OEE): availability × performance × quality. Use OEE trends to prioritize interventions. – Throughput and takt time: measure per cell and per shift to spot bottlenecks. – First-pass yield and defect types: capture defect codes at point of detection, not just count. – Mean Time To Repair (MTTR) and Mean Time Between Failures (MTBF): link to spare-part inventories and maintenance schedules. – Cycle-level sensor telemetry: pressure, torque, vision-pass rates, and robot path deviations stored at sufficient resolution for event reconstruction. – Process parameters and setpoint drift: record both commanded and actual values to detect sensor/actuator divergence. – Traceability records: unique identifiers for parts, process steps, and timestamps to support recalls and warranty analysis.
Where the data comes from — practical sources and integration
Data arrives from PLCs, robot controllers, vision systems, torque monitors, MES and operator terminals. Standardize formats early: prefer OPC UA for telemetry and use MQTT or industrial APIs for event streams. Keep raw streams and reduced datasets in parallel: raw for forensic analysis, reduced for dashboards.
Monitoring architecture and tooling for real production floors
Design a layered architecture: edge collection, local preprocessing, centralized time-series storage, and analytics. On the shop floor, place short-retention buffers at the edge to avoid data loss during network outages. Centralize long-term storage for trending and compliance.
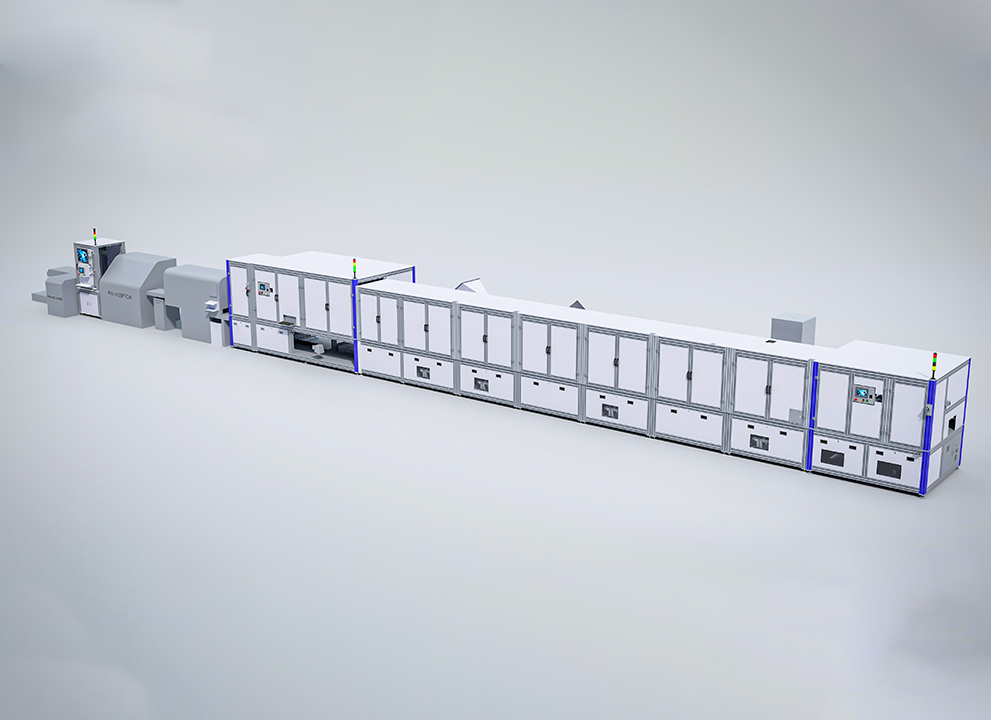
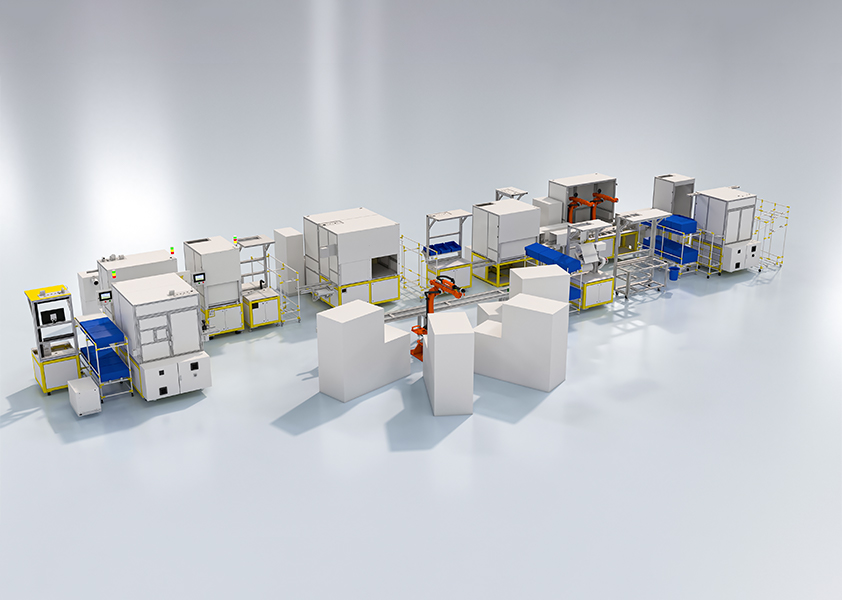
Tool choices should support high-cardinality joins (for traceability) and sub-second query latency for alerts. Hybrid on-prem/cloud setups are common: real-time decisioning lives at the edge; model training and historical analytics sit in the cloud. For deployments on an automated automotive assembly line, ensure network segmentation and secure device identity to protect control systems.
How to turn raw streams into actionable signals
Define event logic that converts noisy telemetry into meaningful events. Examples:
– Threshold breaches that persist beyond a debounce window. – Pattern detection for intermittent torque spikes preceding a defect. – Composite events like “robot slowdown + conveyor jitter + rising reject rate” that trigger a fault ticket.
Use statistical baselines and anomaly detection tuned to process variance—not generic defaults. Validate models against labeled incidents from past shifts. Keep human-in-the-loop review for model drift and unexpected correlations.
Common pitfalls and how to avoid them
Don’t collect everything and hope for answers. Common mistakes and fixes:
– Over-instrumentation without taxonomy: define a naming convention before adding tags. – Storing telemetry at excessively high resolution everywhere: sample strategically and keep raw buffers only where needed. – Treating alerts as data: instrument how operators respond and track closed-loop effectiveness. – Ignoring change management: version sensor calibrations, firmware, and process recipes in the same system that houses metrics.
Implementation checklist for a pilot
Use a focused pilot to prove value quickly. Key steps:
1) Select one critical line, one shift, and one failure mode to study. 2) Map required signals to controllers and vision outputs. 3) Implement edge preprocessing and a secure pipeline to central storage. 4) Run parallel analytics: simple dashboards plus one anomaly detector. 5) Measure leading indicators (sensor patterns) that predict the chosen failure, then iterate.
Evidence and governance — keeping data trustworthy
Assign ownership for data quality and access. Implement retention policies, audit trails, and tamper-evident logs for traceability. A single reference point for definitions avoids misinterpretation between engineering, quality, and operations. Operational metrics should tie back to validated process documents and periodic calibration checks.
Final synthesis
Measure the signals that explain why performance changes, not every available signal. Start small, iterate with tight feedback loops, and enforce consistent naming and governance. Practical experience from assembly lines in the Detroit metro area shows that disciplined data selection and layered architecture reduce downtime and accelerate corrective actions. Effective monitoring combines real-time edge decisions with centralized analytics and documented processes — that blend is where operational improvements become repeatable and auditable for plant teams and stakeholders at scale FHS.